

Communications Troubleshooting & Diagnosis
In this example case of use, we illustrate through real-life examples the power of the trafMon tools in conducting communications trouble shooting. This is reproduced in an associated tutorial document that also highlights the relevant portions of the configuration file permitting to produce the types of traffic observations underlying the described troubleshooting scenarios.
1. ICMP Errors mapped to the concerned Data Flow
The ICMP protocol mostly encompasses error messages at IP network layers that are induced by one or several packets belonging to a given data flow. While decoding such ICMP error reporting packets, the trafMon probe retrieves the using data flow instance in order to increment its corresponding error counter part of its observed statistics.
In the figure below, the DNS (UDP port 53) responses data flow from server (141.253.221.224) to client (10.201.0.11) is experiencing a large amount of Unreached error: 1266 over the 6 weeks period where these DNS packets are generated during 2.3381 percent of the covered minutes.

But, by looking at the corresponding flow IP Counters and their evolution chart, It doesn’t seem to be a permanent problem: indeed, there are far more data packets than ICMP error occurrences. So the client side could experience network problems. Being a private IPv4 address, the root cause could lie in the inter-LAN connectivity: intermittent VPN link or lack of static return route over one of the possible inter-LAN paths.


2. FTP File Transmission Problems, with Aborts and Restart
2.1 Operators or Conversations report per Server
Thanks to the in-depth protocol dissection and FTP sessions follow-up, the tool permits to pinpoint problems occurring during file transfers with one particular remote client.
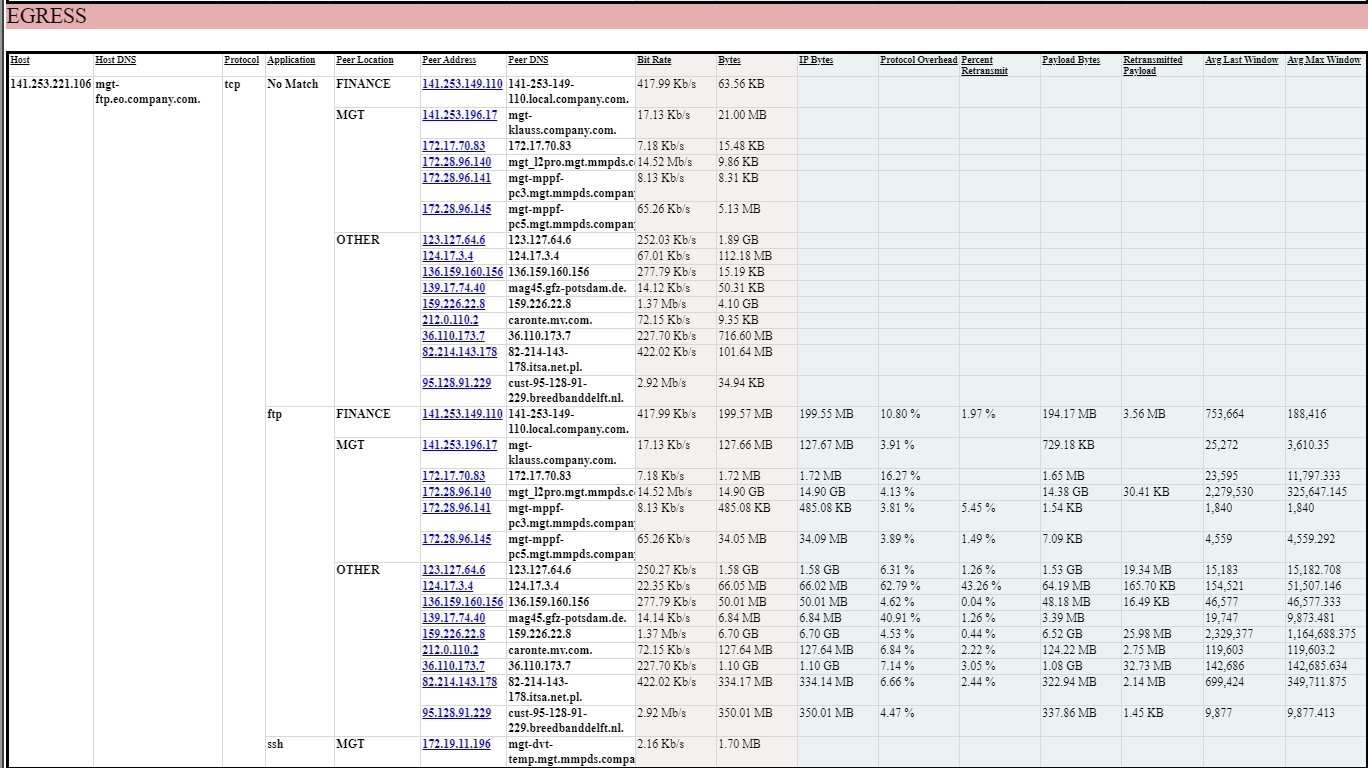
First, we start with the synthetic Operators report applied to a given FTP server: 141.253.221.106:21, and we look at its communications with peers (i.e. FTP clients in our case):
- Ingress traffic from 36.110.173.7 is not really big (17.92 MB), but experiences 1.23 % of retransmission, although consisting mostly in empty acknowledges (only 1.38 KB of TCP payload) of files that are actually traversing in the reverse direction (downloads):

- But more significantly, egress traffic to 36.110.173.7 forms the bulk (1.10 GB) and experiences 3.05 % of retransmission in supporting the actual download of data files:
2.2 FTP Summary shows transfers of longest duration
The files downloaded by this client take a relatively long time: 6 of the top-10 longest files transfers during the 3.5 hours!

2.3 FTP Counters Report shows Aborts and Restart
When looking at the FTP Counters for the bi-directional data flow, we see that it incurs 8 FTP Aborts and 1 FTP Restart!

2.4 Looking at individual file transfers – FTP Details
Now, we can look at the individual file transfers for this client on that period of time:


It shows that the user ‘repository‘ has fetched, at ‘2017-07-10 11:40:01‘, the file ‘SWB_FAC_MICE_20140504.cdf‘ as part of its multi-file transfer session that started at ‘2017-07-10 11:31:06‘; the file size has been announced to be 12 452 608 bytes and the TCP payload actually sent was 12 755 020 bytes (implying TCP retransmissions).

This wasn’t apparently fully successful, because at ‘2017-07-10 11:40:01‘ the transfer of the same data file has been restarted at offset of 12 450 880 bytes – during a new session started at ‘2017-07-10 11:45:50‘ and commanding, thereafter, subsequent transfers of other files – resulting in a transfer of 1964 bytes.

2.5 Looking at individual file transfer connections – TCP Details
Now, we can analyse what has happened during those two corresponding TCP data connections, supporting the first and re-started transfers of the subject data file.
- We ask for the report on TCP Details covering the same FTP data flow from 11:32 until 15:03 on that day (2017-07-10):


- And we see that the first attempt to transfer the file has resulted in a non-negligible amount of retransmitted TCP segments and, consequently, the TCP window size has been significantly reduced compared to the maximum reached during the TCP connection lifetime.
This does not only happen for the transfer of this data file, but also for the other (subsequent) TCP connections transferring other data files:

- Although, for the re-started transfer at ‘2017-07-10 11:46:51’, the volume was small enough to avoid any retransmission, so that the last window size is equal to the maximum reached:

3. Abnormal increase in transmission Delays and Packet Losses
3.1 Detecting Slowdown in Two-way Delays
By inspecting two-way delays with a remote private site, we look at the delays with one of our private address: 172.19.11.10. This is a FTP client that conducts file transfers in active mode based on server-side TCP port 20.
The delay with the local server is meaningless, but that with the remote client, acting as FTP data connection initiator, shows a surprising short jump in delays on ‘2017-07-03’ around 21:00 – 22:00.


Fortunately, we are also monitoring this remote system through regular SNMP polling: regular SNMP get request/response pairs with IDP port 161.
So we look at the two-way delays of the corresponding SNMP flow. And we observe a similar slowdown in the same time frame.

3.2 Analysing Slowdown in One-way Latency
By having installed another trafMon probe at our remote site, and having configured the one-way monitoring of this low volume SNMP data flow, we can further investigate the traffic abnormality.

We see that the slowdown is really an abnormality compared to the 15 millisecond constant latency. But we can also see that the average and distribution of latency are quickly increased as is the number of packets, and that they slowly diminish, more or less in conjunction with the decrease of packets (look at the cumulated size of the bubbles and in the table of values).


3.3 IP Counters confirm the Traffic Burst
When looking at the IP Counters of the traffic with the concerned remote host, locally seen at the side of the SNMP manager, we get the confirmation of the sudden traffic burst, which is accompanied with frequent ICMP errors.

3.4 One-way Counters reveal Packet Losses
The latency analysis concludes to a network path saturation due to traffic increase. And the associated one-way counters show that this slowdown is accompanied with occurrences of packet losses in the manager-to-agent direction of the SNMP data flow.


In the reverse direction, the slowdown is also clearly visible in the latency report.

But, more surprisingly, few packets are detected at destination side while not seen at their source: one way missed packets.
3.5 trafMon Processing Events are kept with the database observations
Because we know that the cause is a bursty increase in packets, we look at the events published by the probe (named chioggia) at the agent source side, where packets have been missed. Maybe the packet capture buffer was overflowing, in which case the probe would have reported an event.
In order to let you participate to the continuous building of the tool, we haven’t implemented ourselves any BIRT report that shows the event log. So we go to query the MySQL the database directly: for instance, though the installation and use of the phpMyAdmin open source utility.
SELECT * FROM `trafMon`.`eventtable` WHERE `time` BETWEEN ‘2017-07-03 21:00:00’ AND ‘2017-07-03 23:10:00’

In fact, we see the trafMon collector (rho) mentioning the lost and incomplete (missed) packets, but no message from the concerned probe about its load level or the saturation of its capture buffer.
Hence, this means that the missed packets are due to the saturation, upon burst of traffic, at the mirror port of the switch to which the probe is connected.
This page can also be downloaded as document: Use Case 2: Communications Troubleshooting & Diagnosis